Unity - Coding tips
The following tips will help you write better code so your game runs smoother in the browser.
Memory optimization
Unity uses a memory heap to store the objects, scenes, shaders, etc. when your game is running in the browser. The memory heap is resized automatically by Unity when needed. However, errors may happen during the resizing process, since the browser may fail to allocate more memory for resizing the heap. That's why it's important to keep your memory usage as low as possible. This also benefits the game when running on weaker devices, like mobile devices. You can find more information about memory usage on the official Unity documentation.
Garbage collection
The garbage collector runs at the end of every frame in WebGL, so there are various minor optimizations you can do to your code to generate less garbage.
- avoid doing string concatenation in loops, since this may generate a lot of garbage during a single frame and Unity may run out of memory
- for string concatenations, if the number of concatenated elements exceeds 10, it is recommended to start using StringBuilder
- cache arrays returned by the functions before using them in a for loop. In other words, avoid
for(int i=0;i<getArray();i++) - use
gameObject.CompareTag("tagName")for tag comparison, since it doesn't allocate memory for the tag and is much more performant - for coroutines, cache the yield, for example,
var delay = new WaitForSeconds(5.0f);if you need to return it multiple times
Addressables
The addressable assets are loaded directly into the heap and the browser doesn't need to allocate memory for them. Another benefit of addressable assets is the decreased loading time for your game since the unity data files will be smaller.
Check the Addressables package for more info.
You should host your external assets (they should be present in a StreamingAssets folder) on CrazyGames. Just upload both the Build and StreamingAssets folders.
Memory profiler
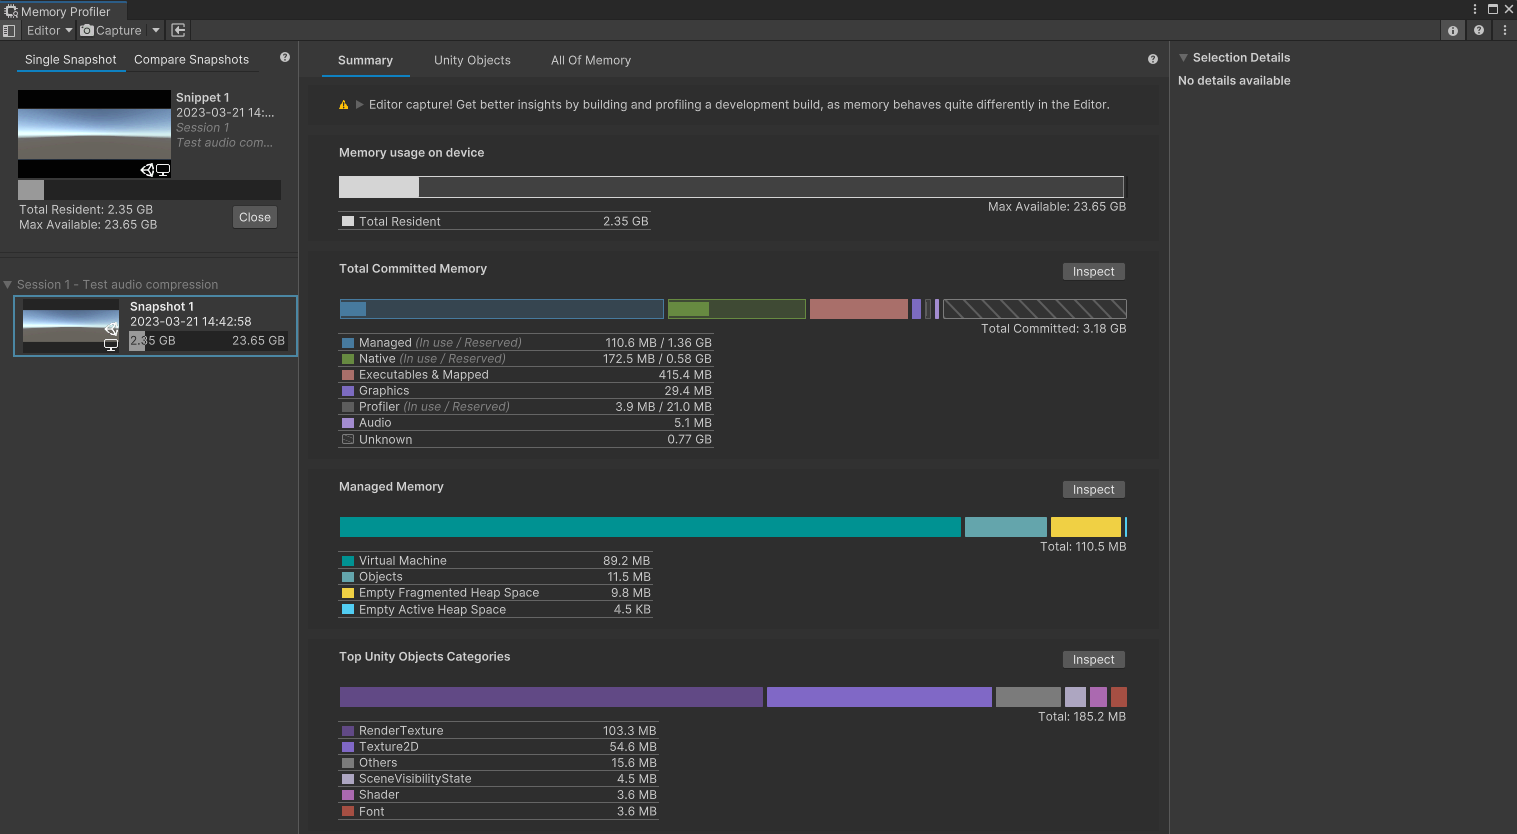
To get a better overview of memory usage, we recommend using the Memory Profiler package. With the help of this tool, you can capture a snapshot of the memory usage at any given moment, and get an overview of the resources using the RAM memory.

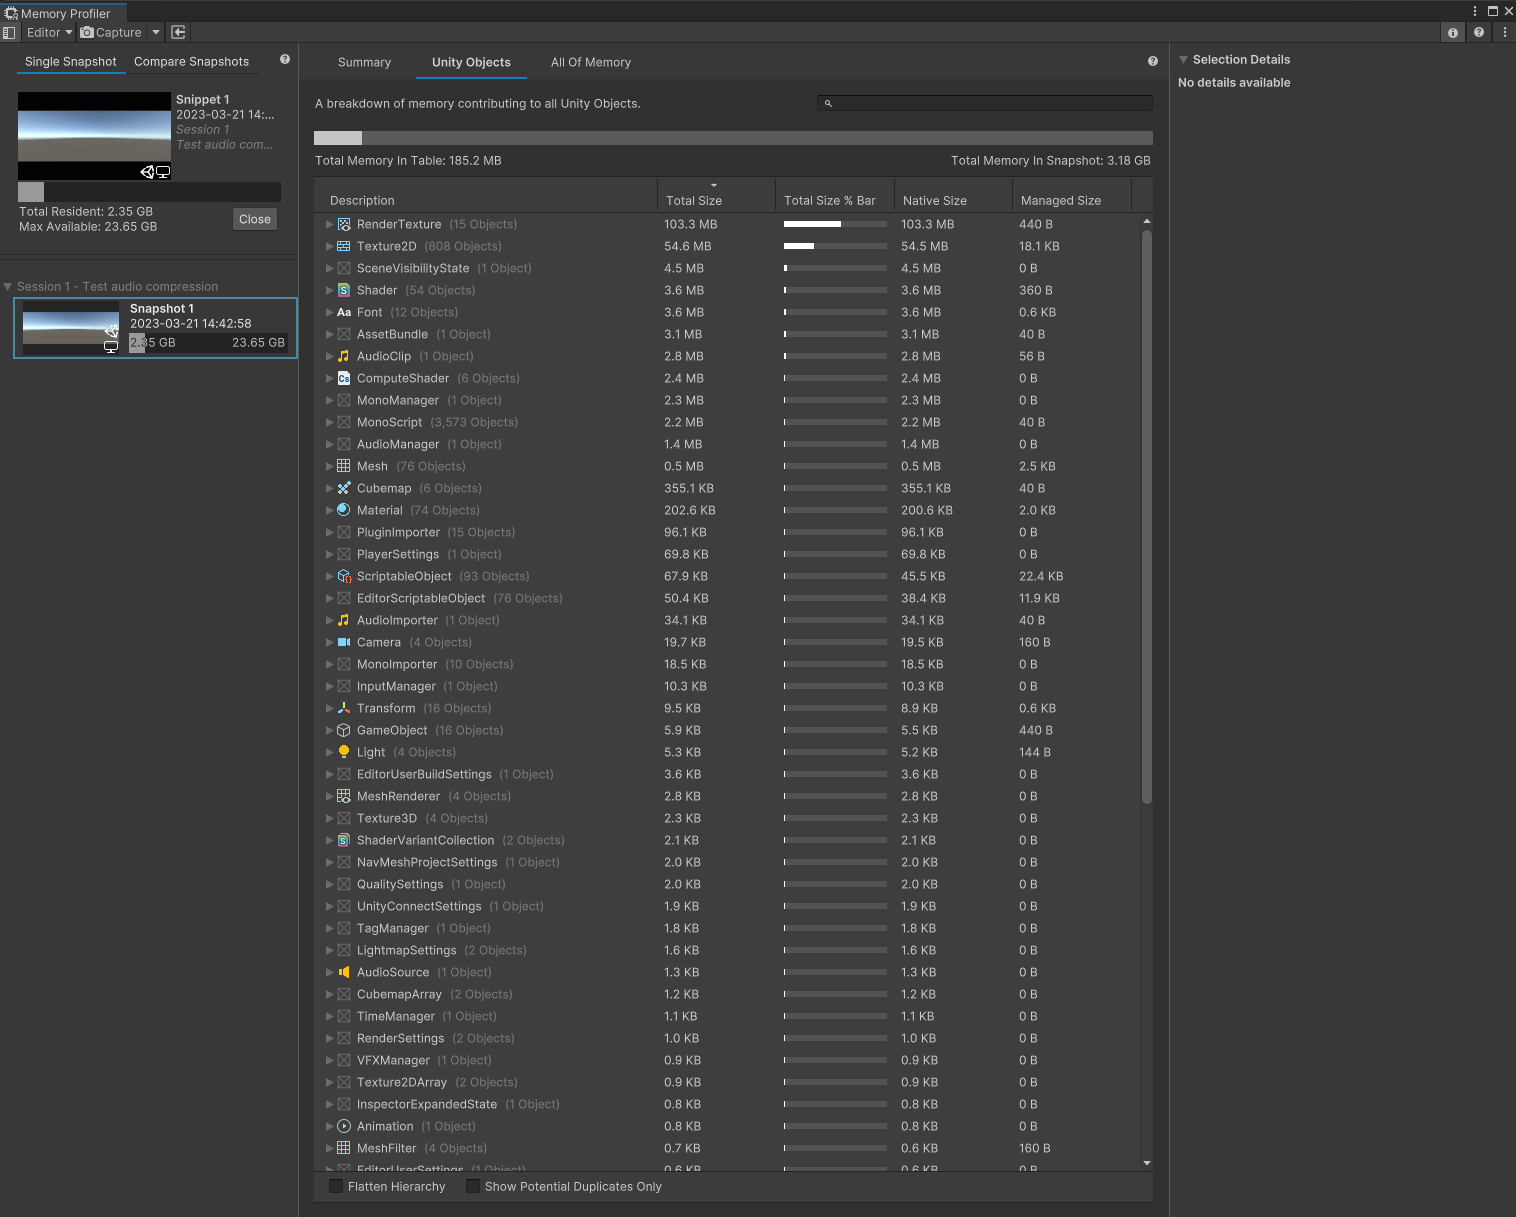
In the Unity Objects tab, you will get a better overview of the meshes, textures, shaders, fonts, audio clips, animations, and many other things that are loaded in memory during the runtime.

See if there are for example:
- unused resources, like textures, meshes, objects, etc. This means that they are referenced somewhere and get loaded, when in fact they aren't used in the game.
- background audio clips taking too much space. Their load type can be set to CompressedInMemory to reduce the runtime memory usage.
- textures, meshes, audio clips that occupy too much memory. Can they be simplified, downsized, or compressed even more to take less memory?
Other
Target frame rate
Unity allows customizing the target frame rate, at which your game will be rendered. This may be useful on mobile devices, however, it should be avoided on WebGL since it may decrease the game performance in browsers.
The default value for Application.targetFrameRate is -1, and should be kept like this on WebGL. This means that the browser itself will control the frame rate, which provides the best performance on WebGL.
External resources
This talk from JS GameDev summit 2022 may help you avoid some common performance and memory issues. Alternatively, this talk, given by one of our own product engineers at the JS GameDev summit 2023, can also help you optimize your game.